Tuesday, December 27, 2022

An Iterative AI based approach to Pediatric self-screening diagnostic

Opportunity for AI

It is well known that children get sick more often, as part of the natural process of developing their own immune systems. Consequently, the need for diagnostics is much more frequent, putting the burden on parents. According to data from the National Health Interview Survey, in 2019, more than one in four children had one or more visits to an urgent care center or retail health clinic (26.4%) in the past 12 months. 


Unnecessary visits to ER represent an enormous waste of valuable medical resources, not to mention the economical and societal cost, as well as impact on the well-being of each individual family. According to a multi-year analysis of children’s visit to ER in hospitals in Italy, 75.8% of the visits are unnecessary. Most of the ER visits are result from independent decision of the parents (97.2%), especially in the evening and at night on Saturdays/Sundays/holidays (69.7%).


A distinguishing characteristic with children’s diagnostics is the high percentage of cases resulting from common illness. In the above study, the most common trigger resulting in parents’ decision to visit ER was fever (51.4%)


Opportunity is ripe for an AI system which can identify the most common illness that does not require ER visits with a certain degree of accuracy. There is no need to provide diagnostics for complex diseases. That is a fundamental consideration when it comes to collecting data, designing, and building such a system.


Proposed Design

Illustrated below is a proposed design which is based on the following principles:

  • Simulating the knowledge and iterative diagnostic process of a physician
  • Utilizing combination of AI technologies including NLP, vision models
  • Focusing on well-defined target outcome (diagnostics of common childhood illness)

Here are highlights of how the system works:

  • Allow user to start with free text description of the symptoms and illness
  • With a predefined list of symptoms, use transformer model to do Reverse Asymmetric Semantic Search against the user query, resulting in a list of matching symptoms (binary features)
  • With well defined symptom-disease data (see next section), use a classification model to predict a list of candidate diseases based on symptoms
  • Based on the candidates identify additional information to probe user for, iteratively predict/probe until threshold is met
  • Incorporate additional model into the system (image, video)
  • Arrive at diagnostic (or no diagnostic), present result and recommendation to the user


Prototype - Proof of Concept

Illustrated below is a prototype built to demonstrate the concept and how different AI components work together to form a more sophisticated system.

The prototype is built around two machine learning models, an NLP model that is designed to turn free text input into symptom features. The symptom features are fed into a symptom-disease predictor to get a diagnostic.

More details are provided in the following sections.

Sample Disease/symptoms Data

Below shows the sample dataset used, each patient case is diagnosed with a disease, together with observed symptoms.


To prepare data for training, we encode each patient case, with disease as the prediction target, and symptoms as encoded features.

Predictor model

We can use gradient boosting to train a classification model that predicts disease based on symptoms. Here is the outcome of a LightGBM model, showing both the overall accuracy and per disease.


User Query

With this component, we use a transformer model to vectorize all the symptoms, and the incoming NLP query. By performing asymmetric semantic search with each symptom, we get a list of “activated” or matched symptoms.


We choose a threshold to apply against above matching score, to generate symptom feature for the query case, now we are ready to make a prediction using previously trained disease predictor model.


Use previously trained classification model to predict the disease:

Finally, we combine with other data to return complete diagnostic info to user.


Github

Sample code for prototype can be found here: https://github.com/seanxwang/pediatric_self_diagnosis

Summary

Reducing unnecessary ER visits by even just a small percentage would translate to millions of unnecessary visits avoided and potentially billions of economic values. An AI based pediatric self-diagnostic system is both in demand and viable. A simple prototype demonstrates feasibility.  When implementing a more complete version of the proposed system, “toy” data can be replaced with professional quality data source such as PedAM. While there is more work and user evaluation to be done to develop such a system into “production ready” state, its potential to serve consumer and society is significant.

(This article is based on work with Professional Master Program at University of Washington Computer Science and Engineering Department)

Thursday, November 3, 2022

NLP based query of Airbnb properties with Asymmetric Semantic Search

Motivation – Why search Airbnb reviews?

Guest rating and reviews are the most valuable assets Airbnb has. For perspective guests, learning from experience shared by others makes the booking experience more predictable and dependable. However, often there are too many reviews to read one by one. More importantly, Airbnb currently only supports property search based on predefined “filters”, thus excluding rich information contained in reviews to be fully utilized in the search process.

Why enable search specifically for reviews?

  • Reviews written by other guests are more subjective and trustworthy
  • Reviews contain rich info, its free text form allows capturing of unlimited variety of experience, stories, and emotions
  • Untapped potential to expand the power of search, i.e., by matching undefined interest of guests with properties


How would the search feature work?

For example, a perspective guest may be searching for a place to stay in LA. In addition to applying map based selection and filtering with structured features currently supported, one could enter a search query describing desired property such as: “quiet and spacious place close to beach in a safe neighborhood”.


Using the query, the search feature will find relevant reviews among current candidate listings, score based on contextual similarity, and return the top ranked listings with closest matched reviews.


Data Processing

By utilizing raw data from insideairbnb.com, we can get raw user review data updated monthly. To be used with a query application, we can apply data processing to have text data ready for search. In run time, as user search in a particular geography and apply filters, a candidate listing with review data is dynamically generated, which can be loaded into memory to support user query.


Asymmetric Semantic Search

To support query, we apply the concept of semantic search. Specifically, utilizing the state of the art NLP transformer models, we can embed reviews to be represented as a vector space. The subsequent search is simply to compare query embedding with review embedding and find the closest matches with a scoring function such as cosine similarity, thus finding reviews with a high semantic overlap with the query.

In choosing the transformer model to test with, it is important to recognize the type of query which is “asymmetric” in this case. Because users usually enter a short query which is to be matched with reviews which are often longer paragraphs, so we utilize MS MARCO models which are created based on user search queries using Bing search engine.

System Design

As illustrated, a simple prototype design consists of:

  • Selected Listings - user preselection (filter) of perspective listings
  • Candidate reviews - corresponding reviews for selected listing
  • Review embeddings – use transformer to generate sentence embedding for candidate reviews
  • User query – performs asymmetric semantic search against review embeddings
  • Result – select top K matches and present corresponding listing for user


Sample Result

Here are some of the top reviews found to semantically matching the sample query above. Since reviews don’t change, they are pre-transformed to vector form for the search. As a result, the query is fast even with tens and thousands of candidate reviews, and results are highly relevant. Clearly, this represents a powerful new search capability currently unavailable.


Going Beyond Search

While Airbnb is used here as an example for illustration, the approach of combining unstructured feature such as NLP sematic search with structured feature search is generally applicable. Imagine a few scenarios:

  • Amazon – enabling users to search product via user reviews: “the best portable fishing pole others have taken on a flight to Alaska”
  • Netflix – voice enabled search based on user experience: "looking for a Halloween movie for a 3 year old that is scary but fun”

Going beyond search and query applications, here a few additional business ideas to explore:


Summary and Highlights – Continued advancement in text summarization models (think GPT-2) makes a highly feasible to extract the most critical information from large bodies of text. For an Airbnb listing, that could mean condensing from dozens of reviews and generate a highly concise title and subject to describe the property. Unlike owner provided descriptions, it will contain subjective opinions from real user experience, both pros and cons, which is highly valuable to assist with user booking.


Feature Extraction – Currently Airbnb has a structured and predefined set of amenities presented as a checklist. However, each property is unique and NLP models can uncover unique features that has been noted by guests. Imagine there is a property specific feature area in addition to the standard list of amenities. For example: “beach chairs”, “children’s splash pool”, “watching sunset“, “hear ocean wave”, “farm animal”. Since it is not predefined, there is no limitation to what can be uncovered. The additional richness of information would create value for both host and guests.


Recommendation – Airbnb has access to guest’s information and trip history, especially guest’s text query history as the feature becomes available, then a much more detailed and personal profile can be developed. Intrinsic and “soft” features are best uncovered with text and deep learning models. Clearly, the next generation recommendation must go beyond rigid filters, and be built based on “personality” and family profile.


Prototype code can be found on Github. I look forward to testing and applying more AI technology to our everyday living innovatively.

Sunday, March 1, 2020

Boosting Machine Learning Models with Explainable AI (XAI) - Insights on Airbnb listings

With a typical machine learning model, the traditional correlation of feature importance analysis often has limited value. In a data scientist’s toolkit, are there reliable, systematic, model agnostic methods that measure feature impact accurate to the prediction? The answer is yes.
Here we use a model built on Airbnb data to illustrate:
  • Explainable AI (XAI) technologies
  • What can XAI do for global and local explanation
  • What can XAI do for model enhancement

XAI — a brief overview

As AI gains traction with more applications, Explainable AI (XAI) is an increasingly critical component to explain with clarity and deploy with confidence. XAI technologies are becoming more mature for both machine learning and deep learning. Here are a couple of algorithm neutral methods that are practical to use today:

SHAP

SHAP (SHapley Additive exPlanations) is developed by Scott Lundberg at the University of Washington. SHAP computes Shapley values from game theory, by assuming that each feature value of the instance is a “player” in a game where the prediction is the payout. Then a prediction can be explained by computing the contribution of each feature to the prediction. Note SHAP has these desirable properties:
1. Local accuracy: the sum of the feature attributions is equal to the output of the model we are trying to explain
2. Missingness: features that are already missing have no impact
3. Consistency: changing a model so a feature has a larger impact on the model will never decrease the attribution assigned to that feature.
SHAP supports tree ensemble, deep learning and other models. It can be used for both global and local explanation. Please refer to Scott Lundberg’s .

LIME

Local Interpretable Model-Agnostic Explanations (LIME) is based on the concept of surrogate models. When interpreting a black box model, LIME tests what happens to the predictions with variations of data, and trains local surrogate models with weighted features. Finally, individual predictions for “black box” models can be explained with local, interpretable, surrogate models.
Please refer to LIME paper: 

Airbnb booking rate model

The model used here predicts Airbnb booking rate. It is trained with data for Los Angeles area listings, obtained from insideairbnb.com. For simplicity, I use a subset of features to train an XGBoost model.

Insight with global explanation

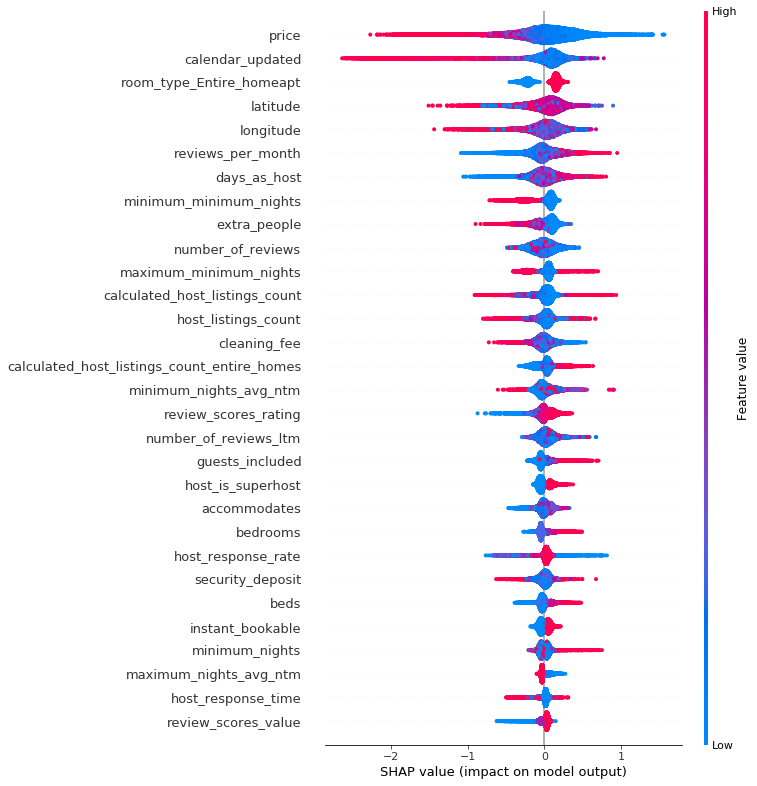
SHAP summary shows top feature contributions. It also shows data point distribution and provides visual indicators of how feature values affect predictions. Here red indicates higher feature value, blue indicates lower feature value. On the x-axis, higher SHAP value to the right corresponds to higher prediction value (more likely listing gets booked), lower SHAP value to the left corresponds to lower prediction value (less likely listing gets booked).


Here are a few insights gained with global feature analysis:

Who are the most successful hosts?

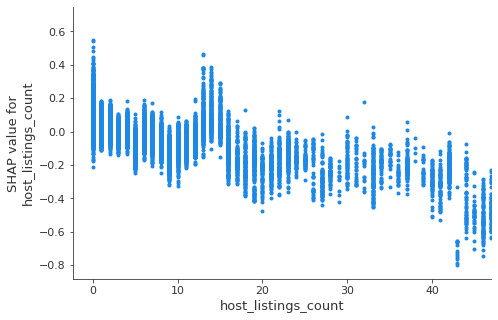
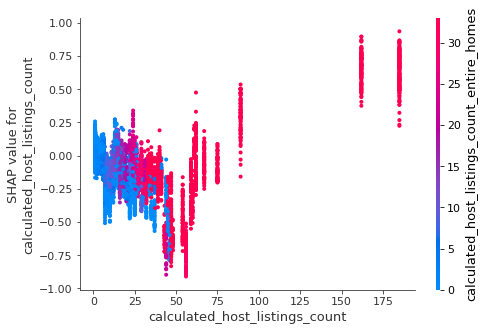
Using Dependence Plots, we can examine the relationship between feature values and predicted outcome. In the first diagram, as the number of listings a host has increases, we see a decreasing trend of SHAP values. In the second diagram, the x-axis shows host listings count, the color shows listings count of “entire home”.
We can probably derive these type of hosts:
  • host with single or a few listings — these are individuals and family, their listing are generally attractive likely due to focus and personal care
  • host with 15–60 listings — these hosts have the least attractive listings, they are probably small hotel or motel type of properties that rents out rooms?
  • host with more than 150 listings — in the second diagram, we can see as the number of host listing increases to above 50, the predicted booking rate increase substantially (reversing earlier trend). Further, those listings are almost all “entire home”. At the top range, those hosts with over 100 “entire home” listings achieve a booking rate of 75% and above which is far superior to anybody else. Are those professionally managed Airbnb property companies?

Higher cleaning fee or higher price?

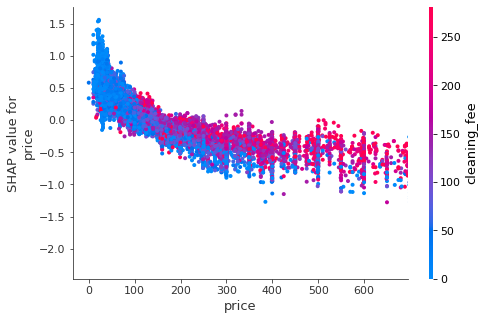
Given the choice, should a host charge more on nightly price or cleaning fee? The dependence plot shows feature interaction between price and cleaning fee. The red color indicates a higher cleaning fee. Along the x-axis, as price increases, predicted booking rate decreases, which is expected. Further, we see listing with higher cleaning fee (red dots) tends to stay above those with lower cleaning fee (blue dots).
Therefore, a listing with a higher cleaning fee is actually favorable when it comes to predicted booking rate. A host who shifts costs more to the cleaning fee probably wins by encouraging guests to stay longer and makes listing price seems cheaper on the front page.


More reviews or higher review rating?

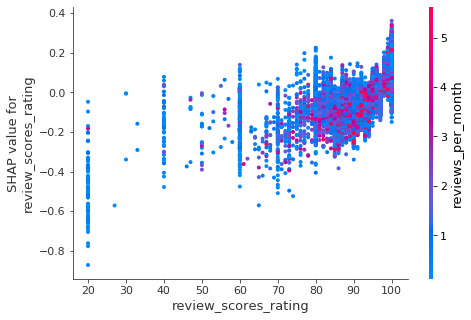
In the diagram, we see an increase in review rating (x-axis) leads to higher booking rate. An increase in the number of reviews, however, does not correspond to better booking rate (red dots are scattered vertically). A host is much better off getting a few good reviews than having a lot of mediocre reviews.

Insight for Local Explanation

SHAP force plot can be used to explain individual predictions. For example, we can see that there is a base value (bias term) of 0.01249, with features in red pushes that value to the right, and features in blue pushes that value to the left, with a combined output of 0.58. Therefore, the effect of top feature is quantified on the prediction with local accuracy. The particular listing has a number of strong features values (superhost, low price, entire home, recent calendar updates) which makes it favorable for booking.


The listing below has a number of feature values (high price of $390, long minimum stay of 30 days, long time calendar hasn’t been updated) that makes it less likely to be booked.


LIME method can be used to explain individual predictions as well, it quantitively shows the effect of top features (orange is positive, blue is negative).
The first example shows a listing with mostly positive feature values (it is an entire home offered by a superhost, with lots of reviews).

The second example shows a listing with negative feature values (it requires a minimum stay of 30 nights and charges a cleaning fee of $150).


Insight for Model Improvement

By examining the global and local impact of features, we can often reveal unexpected patterns of data and gain new insights. With further analysis, we may find the root cause to be one of the following:
  • deficiency with business analysis
  • error with data collection
  • data processing improvement (impute and scale)
  • or, the unusual pattern is a true reflection of new knowledge to learn
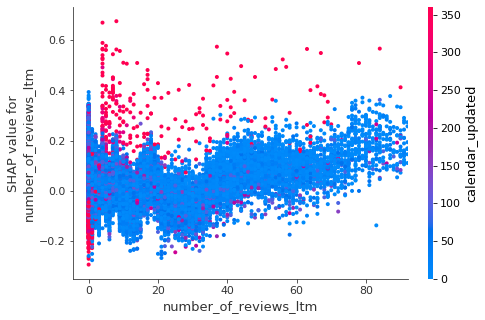
The diagram below shows there are mainly two types of listings with high “calendar_updated” value (red dots). One group, on the left most side of x-axis, who has 0 reviews last twelve month, are essentially stale listing with negative SHAP value and therefore low predicted booking rate. The other red dots are scattered in the upper area which indicates they have higher SHAP value and more likely to get booked. Those are listings that are consistently available and require few calendar updates from hosts. This provides a clue for feature engineering with the goal to distinguish stable listing from training data.

Another example shown here is Skater Partial Dependence Plot which shows the interaction of latitude and longitude features, with vertical axis indicating their effect on prediction. Visually, this 3D diagram can be superimposed on a map of the LA area, which clearly shows central and north area being more popular, and south being the least likely to be booked. This insight can not be gained with analysis of individual features.


Making corrections, adjustments, and gaining new knowledge is part of the iterative model lifecycle which should lead to incremental improvements. XAI can uncover hidden clues and provide critical evidence for that.

Github

A simplified version of the model and XAI code can be found here: 

What is next

Airbnb listings have rich and informative features such as image and text. Incorporating those into models can greatly enhance predictive performance. XAI with deep learning and vision should be both challenging and rewarding as well.

Friday, February 7, 2020

Predicting Market Rank for Airbnb Listings

Motivation

There are several reasons that make Airbnb data challenging and rewarding to work with:
  • Unlike Kaggle, where objectives and metrics are defined, open ended problem definition is a critical data science skill - how to identify a valuable business objective and create analytical framework and modeling solutions around it?
  • Rich information including structured data, text and images to be assessed and narrated - how to deal with having too much data and missing certain data at the same time?
  • Regular data updates from sources such as insideairbnb.com, which provides critical feedback and enables iterative optimization
  • Behind data, are the places, people and their diverse culture, to be interpreted and uncovered. Enhancing Airbnb experience can bring enrichment to humanity and makes it a meaningful and fascinating goal for data scientists

Why predict Market Rank instead of Price?

Airbnb listings contain a rich array of information including structured data, text and images. The convenience and updated availability of data from sources such as insideairbnb.com make them intriguing data science projects. Let’s start by building baseline models.

Model design and training target

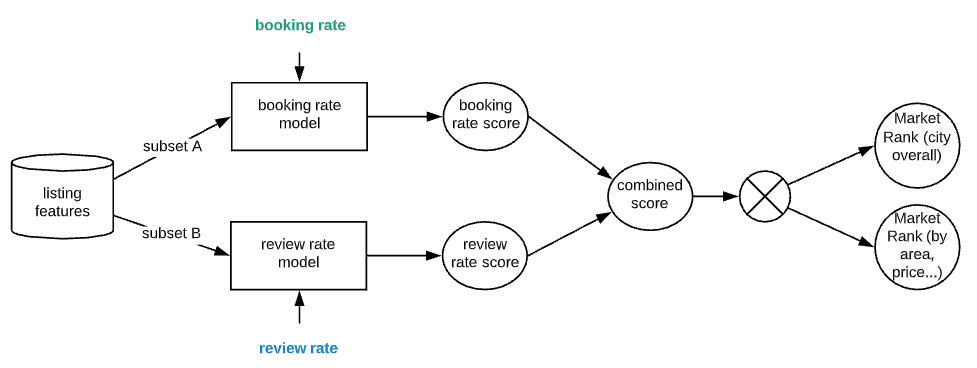
The better a listing does, the higher its market rank should be. How do we define and obtain “market rank” information for supervised training? We are looking for data that tells us how desirable a listing is, or in other words, how fast it gets booked relative to peers. Although we don’t have actual booking information, we have availability and review data that is updated monthly. Let’s look at pros and cons of these two key metrics:
  • For the same target time range, looking at how many more reviews are added and calculates a review rate


Developing Baseline Models

For the prototype, I used data for airbnb listings in Los Angeles, with 2019–03–06 as time A, and 2019–12–05 as time B, and 2019–12–05 + 30 days as the target booking time window. For simplicity, I used XGBoost with minimal amount of data processing and tuning.


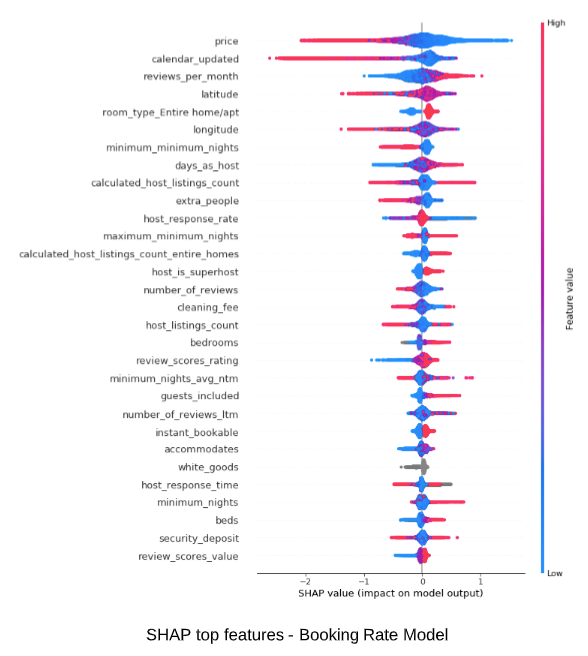
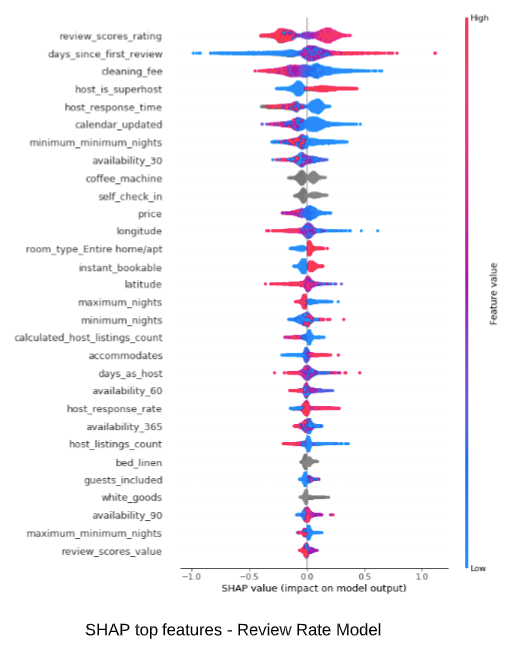
  • Entire home/apt is most preferred by guests
  • Simple features such as coffee machine, self check-in can boost a listing
  • Feature impact are different for the two models, therefore making them complimentary to each other


Market Rank Illustrated

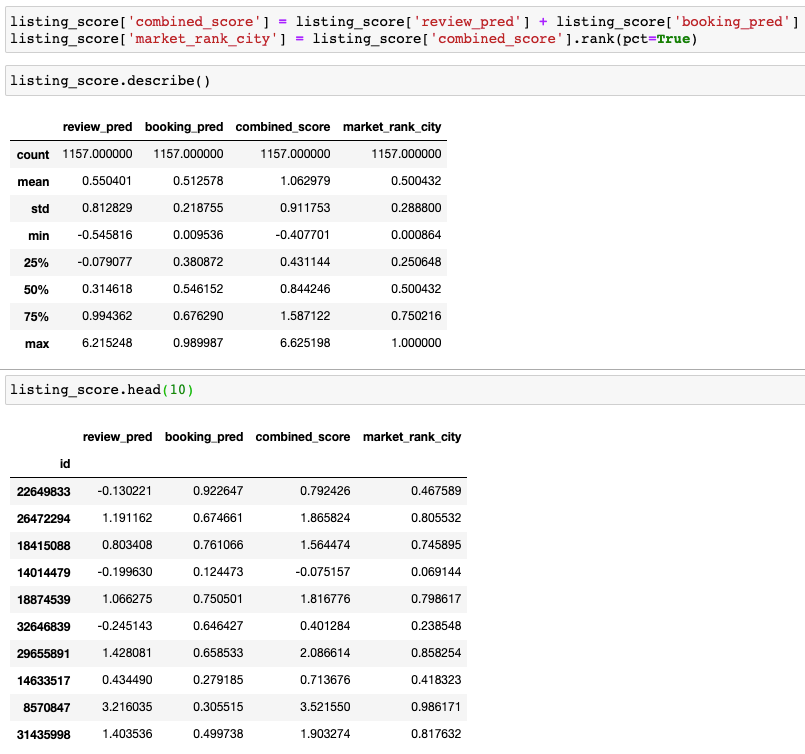
Here we evaluate the models using a reserved test set of listings in Los Angeles area. After combining scores from booking model and review model, we obtain a city wide ranking score (“market_rank_city”) in percentile form. For example, listing ID 8570847 is at top 98.6% in terms of its market competitiveness, while listing ID 14014479 is at bottom 6.9%.


Model performance on new listings

Note we include historical information such as increasing rate of reviews and booking activities to predict future outcome. This is not a form of data leak. Rather, it is a true reflection of how a potential guest evaluates a listing. Consequently, model is more neutral on new listings because of missing information on many features. This is also a true reflection of reality.

What is next

I have shared the journey of a data science project utilizing real world data, starting from a meaningful objective, by researching available data and experimenting with model combination, to promising results. The baseline models developed only scratched the surface of what is possible. Thanks to the vast amount and dynamic nature of airbnb data, further improvements may come from more data scrubbing, feature engineering and algorithm tuning. Adding images and text information also makes for exciting exploration with deep learning.