With a typical machine learning model, the traditional correlation of feature importance analysis often has limited value. In a data scientist’s toolkit, are there reliable, systematic, model agnostic methods that measure feature impact accurate to the prediction? The answer is yes.
Here we use a model built on Airbnb data to illustrate:
- Explainable AI (XAI) technologies
- What can XAI do for global and local explanation
- What can XAI do for model enhancement
XAI — a brief overview
As AI gains traction with more applications, Explainable AI (XAI) is an increasingly critical component to explain with clarity and deploy with confidence. XAI technologies are becoming more mature for both machine learning and deep learning. Here are a couple of algorithm neutral methods that are practical to use today:
SHAP
SHAP (SHapley Additive exPlanations) is developed by Scott Lundberg at the University of Washington. SHAP computes Shapley values from game theory, by assuming that each feature value of the instance is a “player” in a game where the prediction is the payout. Then a prediction can be explained by computing the contribution of each feature to the prediction. Note SHAP has these desirable properties:
1. Local accuracy: the sum of the feature attributions is equal to the output of the model we are trying to explain
2. Missingness: features that are already missing have no impact
3. Consistency: changing a model so a feature has a larger impact on the model will never decrease the attribution assigned to that feature.
SHAP supports tree ensemble, deep learning and other models. It can be used for both global and local explanation. Please refer to Scott Lundberg’s SHAP paper.
LIME
Local Interpretable Model-Agnostic Explanations (LIME) is based on the concept of surrogate models. When interpreting a black box model, LIME tests what happens to the predictions with variations of data, and trains local surrogate models with weighted features. Finally, individual predictions for “black box” models can be explained with local, interpretable, surrogate models.
Please refer to LIME paper: “Why should I Trust You”
Airbnb booking rate model
The model used here predicts Airbnb booking rate. It is trained with data for Los Angeles area listings, obtained from insideairbnb.com. For simplicity, I use a subset of features to train an XGBoost model.
For more information on model design, please refer to https://towardsdatascience.com/predicting-market-rank-for-airbnb-listings-59009a886d6
Insight with global explanation
SHAP summary shows top feature contributions. It also shows data point distribution and provides visual indicators of how feature values affect predictions. Here red indicates higher feature value, blue indicates lower feature value. On the x-axis, higher SHAP value to the right corresponds to higher prediction value (more likely listing gets booked), lower SHAP value to the left corresponds to lower prediction value (less likely listing gets booked).

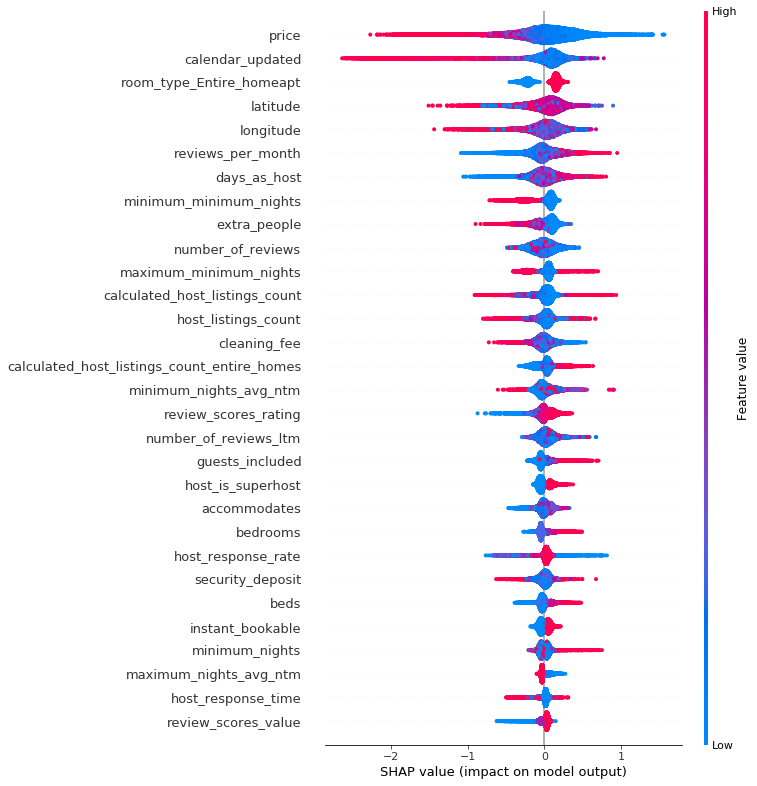
Here are a few insights gained with global feature analysis:
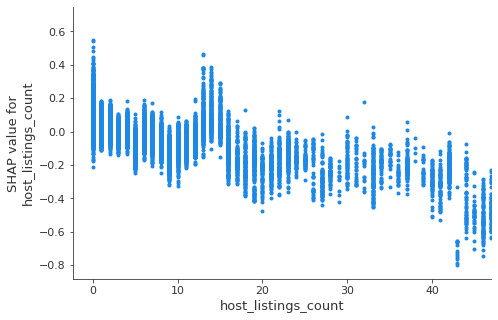
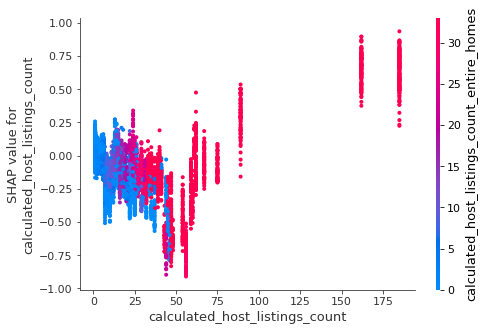
Who are the most successful hosts?
Using Dependence Plots, we can examine the relationship between feature values and predicted outcome. In the first diagram, as the number of listings a host has increases, we see a decreasing trend of SHAP values. In the second diagram, the x-axis shows host listings count, the color shows listings count of “entire home”.
We can probably derive these type of hosts:
- host with single or a few listings — these are individuals and family, their listing are generally attractive likely due to focus and personal care
- host with 15–60 listings — these hosts have the least attractive listings, they are probably small hotel or motel type of properties that rents out rooms?
- host with more than 150 listings — in the second diagram, we can see as the number of host listing increases to above 50, the predicted booking rate increase substantially (reversing earlier trend). Further, those listings are almost all “entire home”. At the top range, those hosts with over 100 “entire home” listings achieve a booking rate of 75% and above which is far superior to anybody else. Are those professionally managed Airbnb property companies?


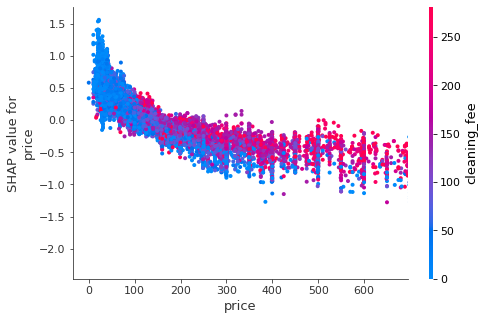
Higher cleaning fee or higher price?
Given the choice, should a host charge more on nightly price or cleaning fee? The dependence plot shows feature interaction between price and cleaning fee. The red color indicates a higher cleaning fee. Along the x-axis, as price increases, predicted booking rate decreases, which is expected. Further, we see listing with higher cleaning fee (red dots) tends to stay above those with lower cleaning fee (blue dots).
Therefore, a listing with a higher cleaning fee is actually favorable when it comes to predicted booking rate. A host who shifts costs more to the cleaning fee probably wins by encouraging guests to stay longer and makes listing price seems cheaper on the front page.

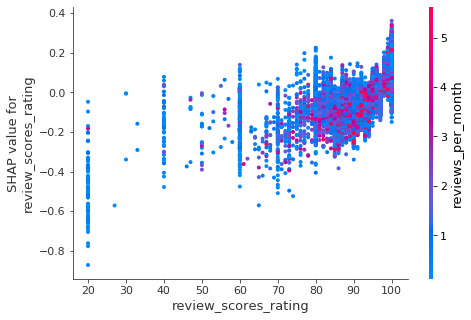
More reviews or higher review rating?
In the diagram, we see an increase in review rating (x-axis) leads to higher booking rate. An increase in the number of reviews, however, does not correspond to better booking rate (red dots are scattered vertically). A host is much better off getting a few good reviews than having a lot of mediocre reviews.

Insight for Local Explanation
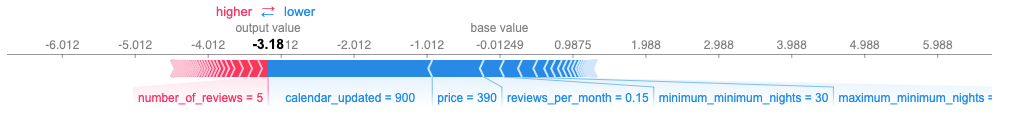
SHAP force plot can be used to explain individual predictions. For example, we can see that there is a base value (bias term) of 0.01249, with features in red pushes that value to the right, and features in blue pushes that value to the left, with a combined output of 0.58. Therefore, the effect of top feature is quantified on the prediction with local accuracy. The particular listing has a number of strong features values (superhost, low price, entire home, recent calendar updates) which makes it favorable for booking.


The listing below has a number of feature values (high price of $390, long minimum stay of 30 days, long time calendar hasn’t been updated) that makes it less likely to be booked.

LIME method can be used to explain individual predictions as well, it quantitively shows the effect of top features (orange is positive, blue is negative).
The first example shows a listing with mostly positive feature values (it is an entire home offered by a superhost, with lots of reviews).


The second example shows a listing with negative feature values (it requires a minimum stay of 30 nights and charges a cleaning fee of $150).


Insight for Model Improvement
By examining the global and local impact of features, we can often reveal unexpected patterns of data and gain new insights. With further analysis, we may find the root cause to be one of the following:
- deficiency with business analysis
- error with data collection
- data processing improvement (impute and scale)
- or, the unusual pattern is a true reflection of new knowledge to learn
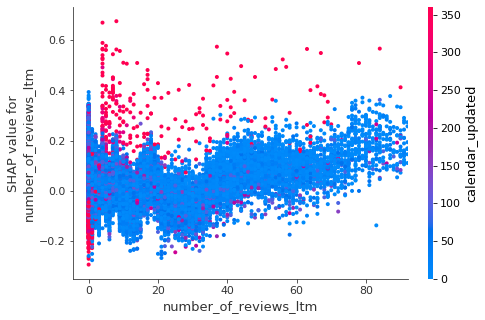
The diagram below shows there are mainly two types of listings with high “calendar_updated” value (red dots). One group, on the left most side of x-axis, who has 0 reviews last twelve month, are essentially stale listing with negative SHAP value and therefore low predicted booking rate. The other red dots are scattered in the upper area which indicates they have higher SHAP value and more likely to get booked. Those are listings that are consistently available and require few calendar updates from hosts. This provides a clue for feature engineering with the goal to distinguish stable listing from training data.

Another example shown here is Skater Partial Dependence Plot which shows the interaction of latitude and longitude features, with vertical axis indicating their effect on prediction. Visually, this 3D diagram can be superimposed on a map of the LA area, which clearly shows central and north area being more popular, and south being the least likely to be booked. This insight can not be gained with analysis of individual features.


Making corrections, adjustments, and gaining new knowledge is part of the iterative model lifecycle which should lead to incremental improvements. XAI can uncover hidden clues and provide critical evidence for that.
Github
A simplified version of the model and XAI code can be found here: https://github.com/seanxwang/XAI-airbnb-booking
What is next
Airbnb listings have rich and informative features such as image and text. Incorporating those into models can greatly enhance predictive performance. XAI with deep learning and vision should be both challenging and rewarding as well.
No comments:
Post a Comment