Motivation
There are several reasons that make Airbnb data challenging and rewarding to work with:
- Unlike Kaggle, where objectives and metrics are defined, open ended problem definition is a critical data science skill - how to identify a valuable business objective and create analytical framework and modeling solutions around it?
- Rich information including structured data, text and images to be assessed and narrated - how to deal with having too much data and missing certain data at the same time?
- Regular data updates from sources such as insideairbnb.com, which provides critical feedback and enables iterative optimization
- Behind data, are the places, people and their diverse culture, to be interpreted and uncovered. Enhancing Airbnb experience can bring enrichment to humanity and makes it a meaningful and fascinating goal for data scientists
Why predict Market Rank instead of Price?
Airbnb listings contain a rich array of information including structured data, text and images. The convenience and updated availability of data from sources such as insideairbnb.com make them intriguing data science projects. Let’s start by building baseline models.
Before designing a machine learning model, the first question to ask is, what is our goal? The goal should also take into consideration the availability and quality of data. A lot of work published focus on price prediction. However, price may fluctuate widely between different dates, which limits a model’s usefulness. Instead, I will focus on ranking a listing relative to its competitors in the market. It is an important design consideration since relative ranking score captures the relative attractiveness of a listing, and makes a model more general to fit with more data and used for more applications.
Here we define market rank as the relative competitive score of a listing in a defined city or neighborhood. How can this prediction model be used? Imagine if you are a host, not only you can see how well you are currently ranked vs the competition, you can also evaluate the effect of altering features (lower price, add amenities…) to improve your ranking. For Airbnb, the ability to predict listing popularity allows effective recommendation for potential guests (“here are top 10 recommended listings in Hollywood for you dates and price range”), or optimization recommendation for hosts (“you will improve your ranking from top 25% to top 10% if you lower your cleaning fee by $20”). Ultimately, the goal is increasing sales and higher customer satisfaction.
Model design and training target
The better a listing does, the higher its market rank should be. How do we define and obtain “market rank” information for supervised training? We are looking for data that tells us how desirable a listing is, or in other words, how fast it gets booked relative to peers. Although we don’t have actual booking information, we have availability and review data that is updated monthly. Let’s look at pros and cons of these two key metrics:
Availability — Availability by itself may be misleading, since a listing can be unavailable either by being booked or host taking off market. By observing availability change from time A to time B, and look at when host last updated calendar, we can more intelligently interpreting change and derive booking activity for most of the listings
Reviews — The increased number of reviews in the target observation window is a good proxy for how well a listing did. There is still a pitfall, those listings with longer minimum date tend to have fewer reviews (relative to the number of days booked)
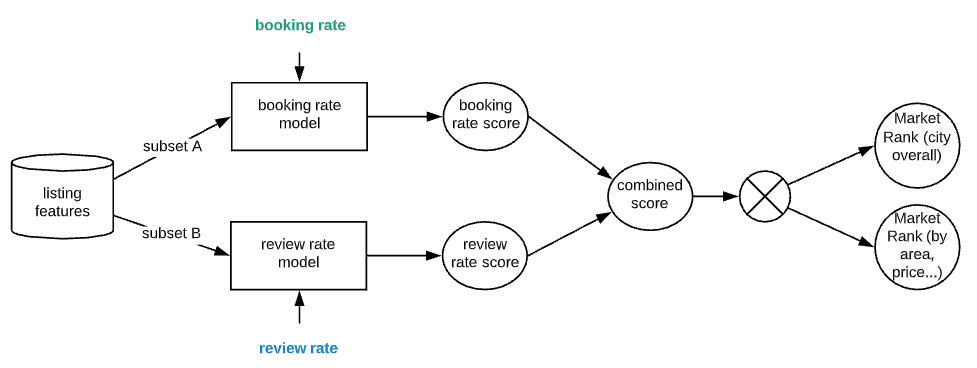
As illustrated, booking rate and review increase rate can be estimated by:
- for a target time range, looking at when host updated calendar and how availability changes over time, calculates a booking rate
- For the same target time range, looking at how many more reviews are added and calculates a review rate

Booking rate and review rate compliment each other to provide market ranking indicators for individual listings. They are scaled and normalized to be used as training target for regression models. For further diversification, I trained booking rate model and review rate model based on subsets of listing features, while preventing data leak. The resulting booking rate score and review rate score are then aggregated to a combined score, which is then used to generate market ranking in percentile form quantifying a listing’s relative strength in any city, area or neighborhood.
Developing Baseline Models
For the prototype, I used data for airbnb listings in Los Angeles, with 2019–03–06 as time A, and 2019–12–05 as time B, and 2019–12–05 + 30 days as the target booking time window. For simplicity, I used XGBoost with minimal amount of data processing and tuning.
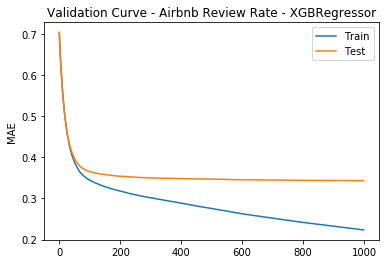
Below shows sample validation curve for review rate model, which has an R2 score of ~0.6. This would serve as a baseline, with potential for improvement by adding features, data, tuning…
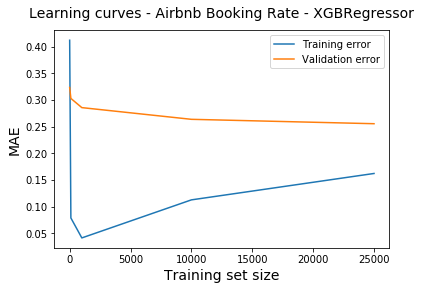
Below shows sample learning curve for booking rate model. The gap between training and validation (which indicates variance) shows narrowing trend with increasing data size. As expected, bias is clearly present as seen from error level, which may be improved with features and algorithm.
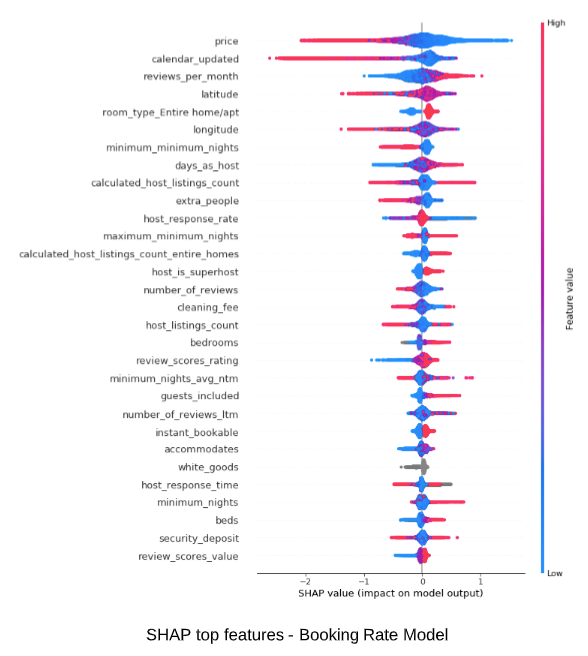
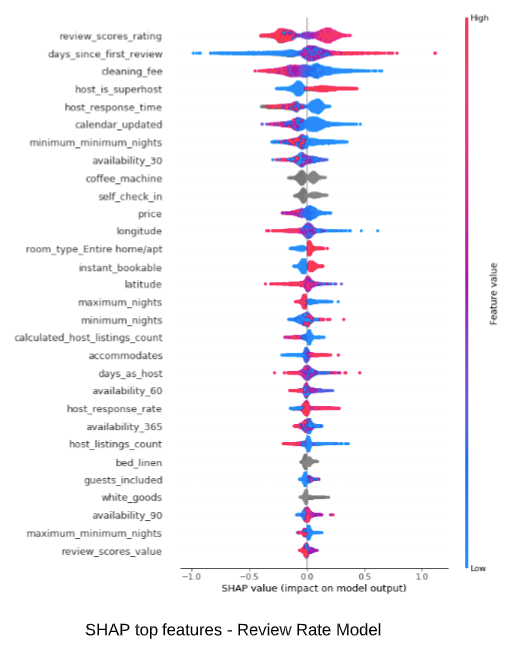
Below shows SHAP summary plots for the two regression models. The features are listed top down by order of their impact on model outcome. For each feature, its impact is visualized by its reach on the horizontal axis. Red indicates higher feature value, while blue indicates lower. An extension to the right quantifies positive impact (higher the feature value, higher the booking and review rate, therefore more hot the listing is). An extension to the left quantifies the negative impact. Some quick observations:
- As expected, higher price, fewer reviews, longer minimum nights negatively affects booking rate
- Entire home/apt is most preferred by guests
- Simple features such as coffee machine, self check-in can boost a listing
- Feature impact are different for the two models, therefore making them complimentary to each other
SHAP (SHapley Additive exPlanations) is an emerging algorithm agnostic Explainable AI (XAI) method which leverages game theory to measure the impact of features accurate to the prediction. Detailed SHAP analysis is outside the scope here.
Market Rank Illustrated
Here we evaluate the models using a reserved test set of listings in Los Angeles area. After combining scores from booking model and review model, we obtain a city wide ranking score (“market_rank_city”) in percentile form. For example, listing ID 8570847 is at top 98.6% in terms of its market competitiveness, while listing ID 14014479 is at bottom 6.9%.
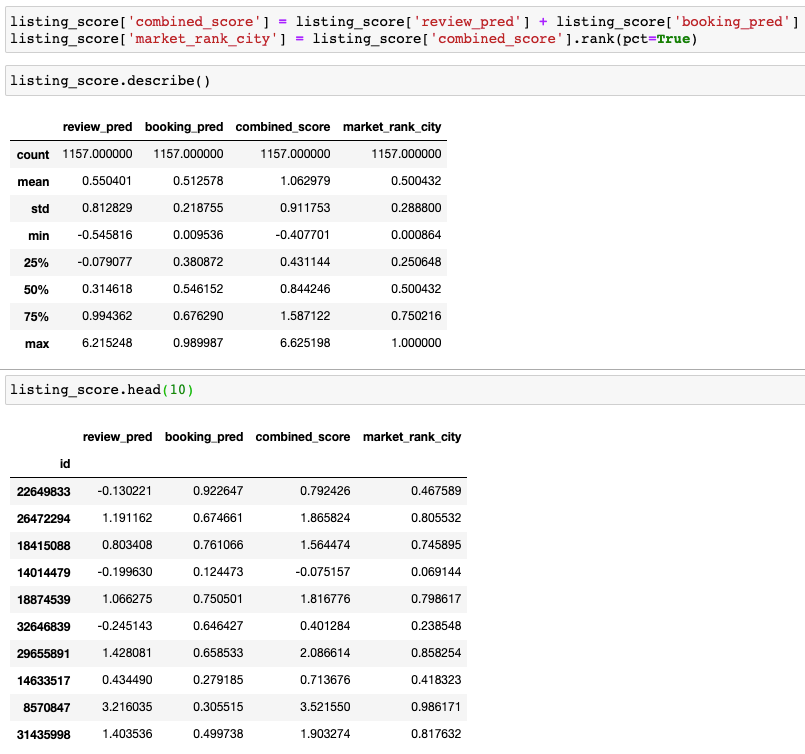
Check out actual listings following standard url format https://www.airbnb.com/rooms/, to see if scores make sense.
Market Rank can also be calculated for a defined target group, leading to more applications. For example, we can rank listings in a particular neighborhood and within a price range. We can apply any feature value as filters to compare competitiveness of a listing in a subset.
Below is an example of calculating percentile rank (“market_rank_neighborhood”) for listings priced at $150-$250 in Hollywood neighborhood.

From the above list, let’s look at the top listing, which is a new 2 bedroom condo with full kitchen, priced at $174/night: https://www.airbnb.com/rooms/32792761
And bottom listing, which is a thirteen square foot room with a double bed, priced at $199/night: https://www.airbnb.com/rooms/28012404
Model performance on new listings
Note we include historical information such as increasing rate of reviews and booking activities to predict future outcome. This is not a form of data leak. Rather, it is a true reflection of how a potential guest evaluates a listing. Consequently, model is more neutral on new listings because of missing information on many features. This is also a true reflection of reality.
To more accurately differentiate the quality among new listings, it is desirable to develop models that focus on features such as amenities, photos, text, and location. Think KNN built on subset of features that is constant with time.
What is next
I have shared the journey of a data science project utilizing real world data, starting from a meaningful objective, by researching available data and experimenting with model combination, to promising results. The baseline models developed only scratched the surface of what is possible. Thanks to the vast amount and dynamic nature of airbnb data, further improvements may come from more data scrubbing, feature engineering and algorithm tuning. Adding images and text information also makes for exciting exploration with deep learning.


No comments:
Post a Comment